
Dashboards
The Dashboard is the first page you see. It shows your workspace at a glance, and you can build as many dashboards as you like: one for the controller’s morning check, one for each team’s own work.
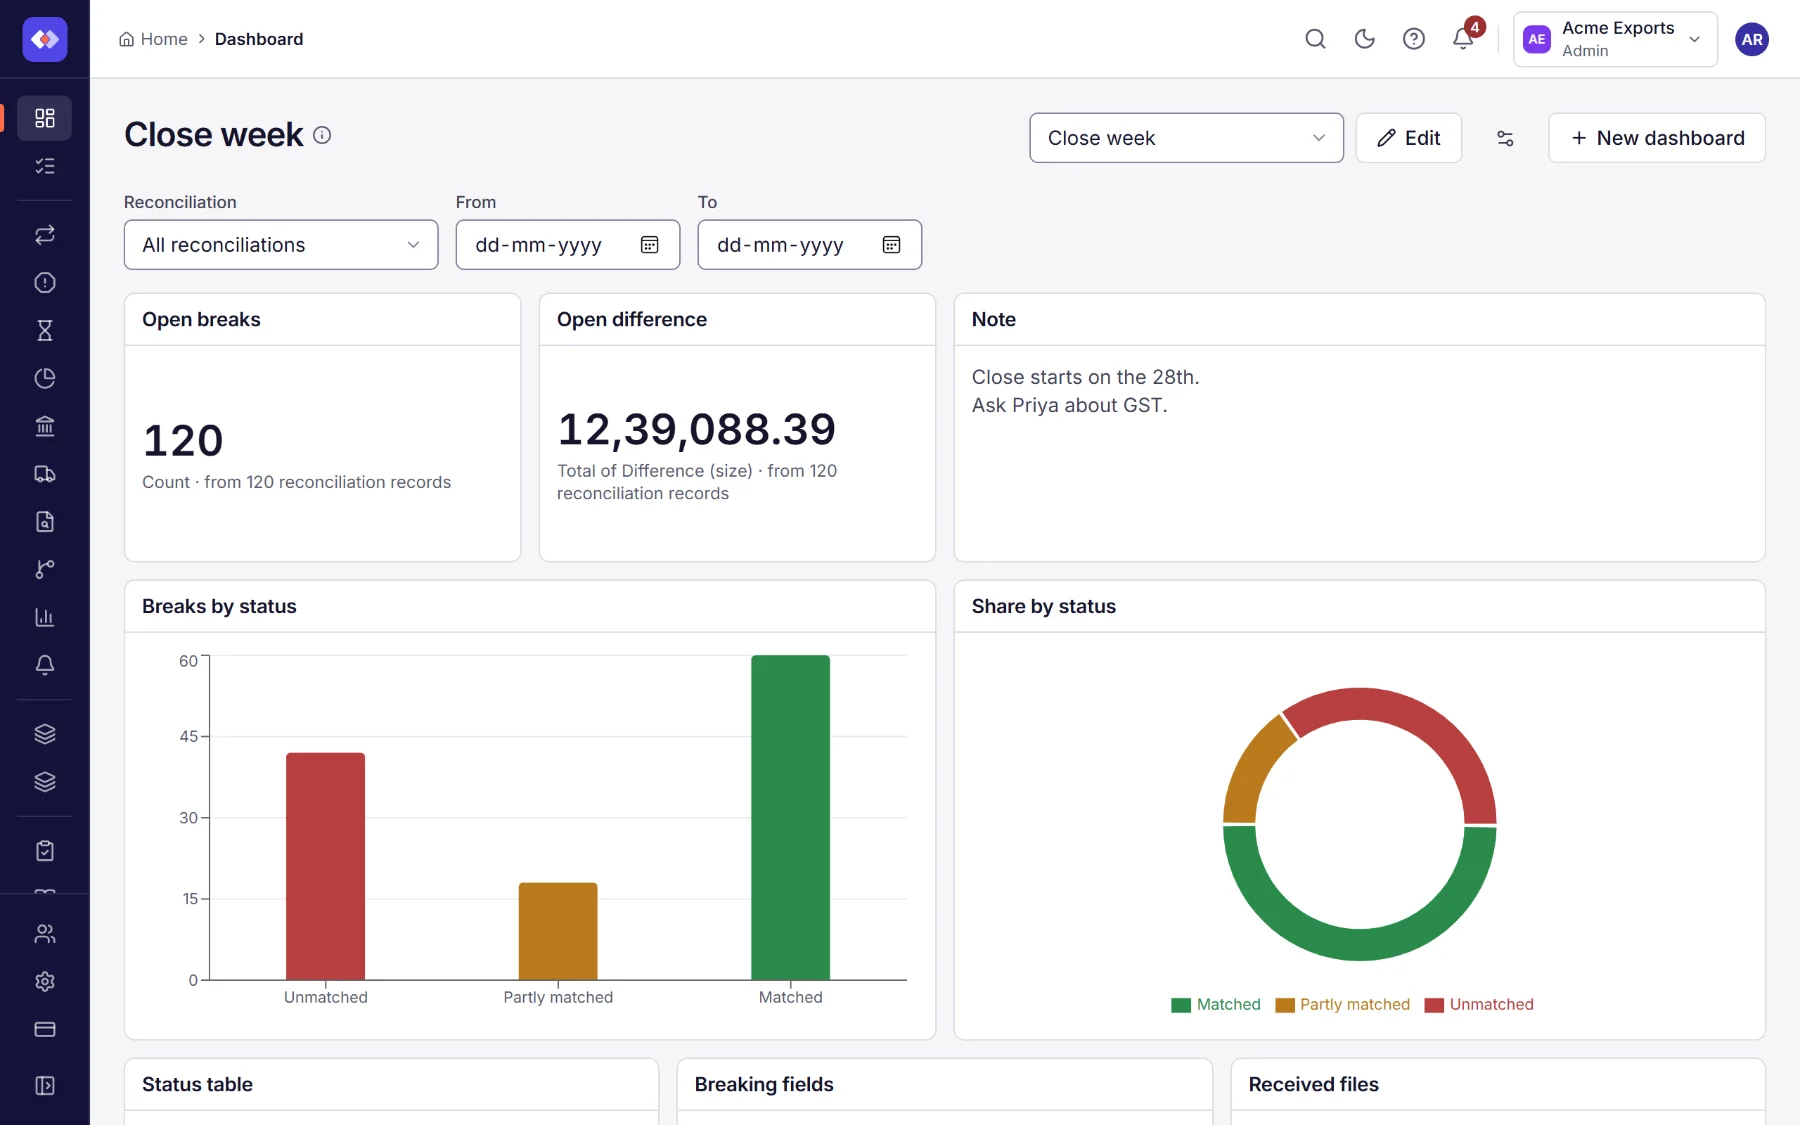
Choosing a dashboard
Section titled “Choosing a dashboard”Pick a dashboard from the list at the top right. Each one remembers its filters (process, date range), which you can change at the top of the page while you look.
Making a dashboard
Section titled “Making a dashboard”- Choose New dashboard.
- Give it a name and, optionally, a description.
- Start with a ready-made set of widgets (Breaks, runs and deadlines, which you can change), or nothing, to add your own.
- Who sees it: the roles for which it opens first, unless a person chose another dashboard. Leave it empty for a dashboard of your own.
Widgets
Section titled “Widgets”Choose Edit, then Add a widget. The ready-made widgets:
| Widget | Shows |
|---|---|
| Open breaks | How many records are still open |
| Overdue breaks | Open records past their due date |
| Open difference | The size of all open differences |
| Match rate | Average match rate of each reconciliation’s latest run |
| Run status | Each reconciliation’s latest run |
| Breaks by process | Open records per reconciliation |
| Breaks by reason | Open records per reason code |
| Match rate over time | Average match rate per month |
| My assignments | Open records assigned to the person looking |
| Deadlines missed | Overdue records by who has them |
Or build your own: choose the data (reconciliation records, runs, open items, journal lines, account certifications), filters, grouping and totals, exactly as in the report builder, and how to show it: a number, bar chart, line chart, pie chart or table. You can also start from a saved report. Filters can use @me, the person looking, so one My assignments widget works for everyone.
Other widgets show a text note (Close starts on the 28th), the breaking fields of a reconciliation, or the latest received files.
Arranging
Section titled “Arranging”In edit mode, drag widgets by their handle and resize them from the bottom-right corner. The filters set while editing are saved with the dashboard. Each widget can be changed, copied or removed.
The overview
Section titled “The overview”The Overview is the dashboard everyone starts with. Its numbers come from each reconciliation’s latest completed run, and only from reconciliations you can open:
| Widget | Shows |
|---|---|
| Total transactions | The records in the latest run of every reconciliation, and how many reconciliations that is. |
| Match rate | How many of those records matched, out of matched, partial and unmatched. |
| Pending review | Breaks not yet approved. |
| Total variance | The differences left in the latest runs. |
| Processes | Each reconciliation, linked to its page, with its last run (running, failed, or when it finished). The bar is that run’s match rate; amber below 80%. |
| Review queue | Matched, pending review, variance and approved records, and the overall match rate. |
| Recent activity | The newest runs: started, completed (with matched, partial and unmatched) or failed (with why). Each links to the run’s records, or to the history for a run that failed. |
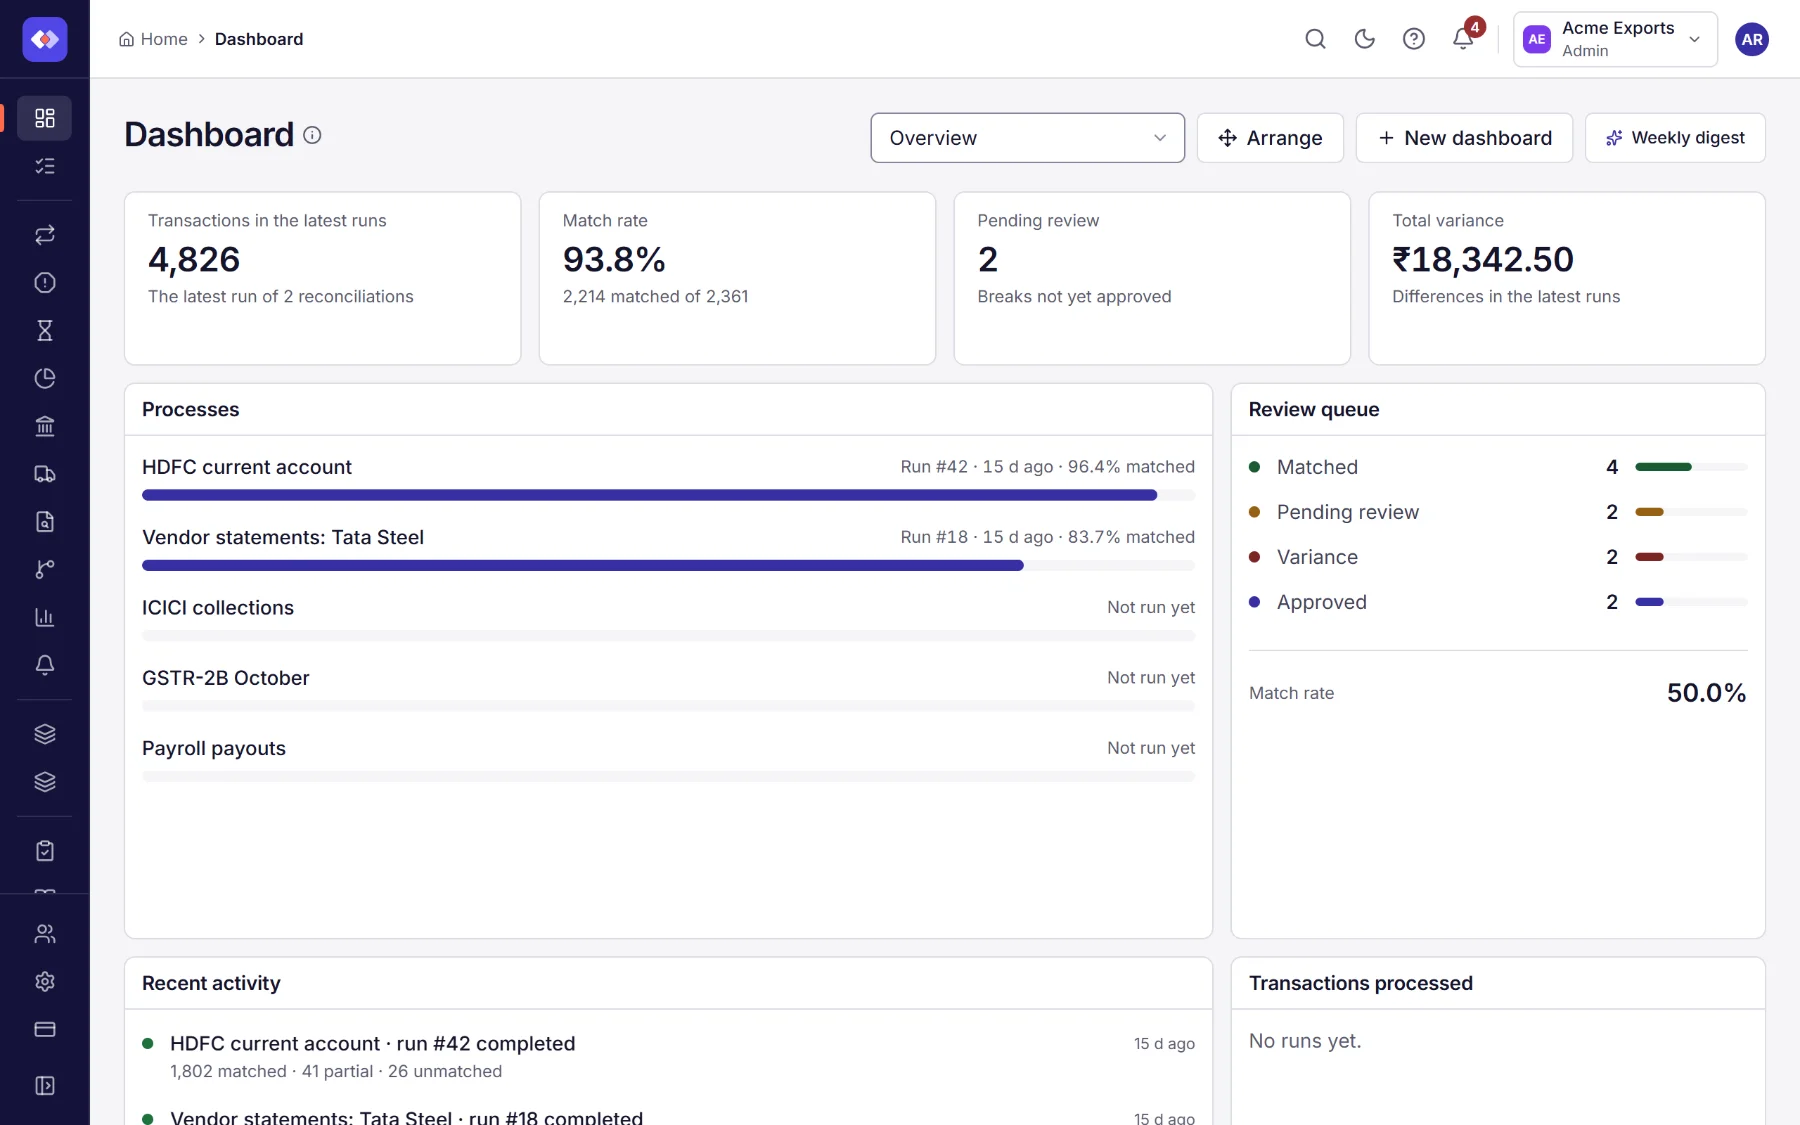
The numbers are read again every minute.
Arranging the overview
Section titled “Arranging the overview”Each person can arrange the overview for themselves:
- Choose Arrange.
- Drag a widget by its handle (drag a total by the card itself) and resize it from the bottom-right corner.
- Choose Save. Reset layout puts everything back where it started; Cancel leaves it as it was.
Your arrangement is yours alone and follows you to any computer you sign in on. On a phone the widgets are shown one below the other, in the order you arranged them, and cannot be moved.